August 2, 2021
NIGHT MODE
DAY MODE
Thoughts related to the Historical Tournament Stats page
— Missed-fairway penalties, fairway widths, and within-event skill correlations
We've recently posted a new page that provides
round-level statistics for every Shotlink-equipped PGA Tour event since 2017 (2015 and 2016 to be added shortly).
These statistics include the standard strokes-gained categories, as well various other statistics derived from
the shot-level data such as approach proximity from the fairway and rough, and driving distance on all holes.
Another interesting feature of this page, which will be the subject of this blog post, is the set of
event-level statistics and mini-analyses we report. We discuss two of these tournament-level statistics in this post:
the average fairway width on par 4s and 5s,
and the implied penalty for missing a fairway.
The two analyses that accompany each tournament page are, first, a simple breakdown of the distribution of approach shots during the week,
and, second, a correlation plot
displaying the relationships between several statisics and overall performance in that tournament.
The latter is the subject of the final chapter of this blog post.
In addition to being interesting in their own right,
these tournament-level features allow us to highlight similarities and differences
between courses that may not be otherwise readily apparent, they
can help us understand which shot types were emphasized and which playing styles excelled in a particular week,
and they can also shed light on the mechanism behind a course's
fit. And with that, enjoy these 3
loosely-related sections.
Estimating the cost of a missed fairway
When thinking through how to define the implied penalty of missing a fairway,
there are a few different approaches that could be taken. The simplest
would be to compare the average score for those who miss the fairway to those who
hit the fairway. This could be problematic for a few reasons, but one issue is that
drives that find the fairway (on average) travel further than those that miss the fairway.
Therefore this estimate will capture not only the penalty from missing the fairway, but also
the penalty from hitting a shorter drive. I'll next briefly describe 3 alternative approaches, all
of which I think convey useful information but also have drawbacks.
On the Historical Tournament Stats page, we report Estimate 1 for the penalty of a missed fairway. The table below shows the three different estimates for Shotlink events on the PGA Tour in 2019:
In addition to Estimates 1-3 described above, we have also added two more
estimates to complete the picture: "non rgh" is the same as Estimate 3 except comparing fairway shots
to non-fairway non-rough shots (e.g. shots from bunkers), and "pen frac" is the fraction of missed fairways that
result in a penalty stroke (par 3s excluded).
In calculating each missed-fairway penalty estimate, the difference in skill between those playing from the fairway and those playing from the non-fairway is accounted for. Perhaps surprisingly, the skill difference is almost negligible when averaged across all events, with an overall gap of just 0.001 strokes (i.e. the average non-OTT skill of those playing from the fairway is 0.001 strokes better per hole than the skill of those playing from non-fairway). This hardly matters anyways, as a meaningful skill difference would be on the order of 0.01 strokes per hole (which is ~0.2 strokes per round), but this is dwarfed by the differences in missed-fairway penalties across courses seen in the table above.
Now, let's discuss some of the takeaways. As expected, Estimate 2 is uniformly lower than Estimate 1, which is due to the fact that the non-fairway shots in Estimate 1 are on average slightly further from the hole than the fairway shots. Overall, however, Estimates 1 and 2 are very highly correlated. Estimate 3 is less correlated; recall that it is an estimate of the difference in the number of strokes to hole out from the fairway versus the rough. The discrepancies between Estimate 3 and Estimates 1 and 2 can be resolved by looking at the final 4 columns. For example, Kapalua, Sea Island, and TPC River Highlands all have low values for Estimate 3 compared to their Estimate 1 and 2 values. This is easily reconciled by noticing that they are ranked #2, #1, and #3 in the fraction of missed fairways that lead to penalty strokes.
One noteworthy course is TPC Deere Run. It consistently ranks in the top half of courses in terms of missed-fairway penalty, and it is specifically driven by the rough penalty, as it yields very few penalty strokes and is relatively easy from non-rough locations. What's the likely story? The John Deere is typically a low scoring affair, and to hit shots close you need to be in the fairway. At the other extreme, you have Riviera, which consistently has the smallest missed-fairway penalty on tour. It's not clear what the whole story is here, but it's likely related to the fact that Riviera also has one of the lowest GIR percentages on tour. There are several courses whose data backs up what intuition would suggest: Bethpage Black, East Lake, and TPC Southwind are all known for brutal (albeit, different) rough, and their penalties for a missed fairway support that sentiment. One course you would think fits this mold, but doesn't really according to the data, is the South Course at Torrey Pines. (Although its rough penalty is still ranked a respectable 9th out of 35 courses.)
With respect to the overall relationships between missed-fairway penalties and course characteristics, there is a positive correlation between the penalty for missing a fairway and how easy it is to hit the fairway. This correlation with overall driving accuracy is strongest for Estimate 1 (0.52) — part of this is mechanical because a 280-yard drive that misses the fairway at say, Kapalua, has to be hit way offline (and will have a longer approach into the green). This correlation decreases slightly with Estimate 2 (0.49), and almost disappears with Estimate 3 (0.08). Therefore, it must be the case that courses with easier-to-hit fairways tend to have hazards or OB closer to the fairway's edge. Kapalua, Sea Island, and River Highlands are all examples of this. Interestingly, there is no correlation between a course's yardage and Estimate 1 or 2, but there is a positive correlation with Estimate 3 (0.25). There is a small negative correlation of all 3 estimates with GIR (-0.1), and a (shocker) positive correlation with score relative-to-par (0.15).
1) Compare the difference in hole score between fairway and non-fairway drives that travelled the same
distance. Because the path from tee to green is (typically) shortest along the fairway, the non-fairway
drives in this comparison will on average have longer approaches to the greens. However, this approach is the
most intuitive: it's answering the question, "If my 280-yard drive misses the fairway, how many strokes can I expect
to lose compared to my 280-yard drive that finds the fairway?". This estimate includes drives that land in hazards
or out-of-bounds — that is part of the (potential) penalty of missing a fairway.
See [1] for the details of this calculation.
2) Compare the difference in hole score between fairway and non-fairway drives that have the same distance into the
green. For the same reason mentioned in (1), the non-fairway drives in this comparison will have, on average,
travelled further from the tee than their short-grassed counterparts. As with (1), this estimate captures all the penalties associated
with missing a fairway (rough, bunkers, hazards, etc), however I would argue it is less intuitive. We could think of it as answering the
question, "If I randomly chose a ball in a non-fairway location and another ball in a fairway location that are equidistant from
the pin, how many strokes can I expect to lose from the non-fairway spot?".
3) Compare the difference in strokes to hole out between equidistant approach shots hit from the rough versus the fairway.
This comparison aims to estimate the penalty of being in the rough, in particular. Often I think this is what people have in mind
when they speak of "the penalty of missing the fairway". Across all courses, we know this difference is about 0.25 strokes
between 100-200 yards from the green
(see page 15 of this Mark Broadie paper).
This estimate is useful for determining whether a course has a high overall fairway
penalty using measures (1) or (2) due to penal rough or due to the impinging presence of hazards. Its obvious drawback is that
it does not necessarily give you the complete picture of the cost of missing a fairway.
On the Historical Tournament Stats page, we report Estimate 1 for the penalty of a missed fairway. The table below shows the three different estimates for Shotlink events on the PGA Tour in 2019:
Penalty for a missed fairway
| event | course | val 1 | rank 1 | val 2 | rank 2 | val 3 | rank 3 | non rgh | non rgh rank | pen frac | pen rank |
|---|---|---|---|---|---|---|---|---|---|---|---|
| the Memorial Tournament | Muirfield Village Golf Club | 0.51 | 1 | 0.5 | 1 | 0.48 | 1 | 0.39 | 21 | 0.06 | 9 |
| WGC-FedEx St Jude Invitational | TPC Southwind | 0.49 | 2 | 0.48 | 2 | 0.4 | 5 | 0.47 | 11 | 0.05 | 10 |
| PGA Championship | Bethpage Black | 0.48 | 3 | 0.46 | 3 | 0.41 | 4 | 0.56 | 3 | 0.01 | 35 |
| Sentry Tournament of Champions | Plantation Course at Kapalua | 0.44 | 4 | 0.37 | 15 | 0.17 | 29 | 0.34 | 26 | 0.11 | 2 |
| The RSM Classic | Sea Island GC (Seaside) | 0.44 | 5 | 0.42 | 4 | 0.2 | 26 | 0.43 | 15 | 0.11 | 1 |
| Travelers Championship | TPC River Highlands | 0.43 | 6 | 0.4 | 6 | 0.23 | 21 | 0.41 | 18 | 0.1 | 3 |
| U.S. Open | Pebble Beach Golf Links | 0.42 | 7 | 0.4 | 7 | 0.34 | 8 | 0.49 | 8 | 0.04 | 17 |
| John Deere Classic | TPC Deere Run | 0.42 | 8 | 0.4 | 8 | 0.44 | 2 | 0.34 | 25 | 0.02 | 29 |
| TOUR Championship | East Lake Golf Club | 0.41 | 9 | 0.4 | 5 | 0.42 | 3 | 0.31 | 32 | 0.01 | 30 |
| THE PLAYERS Championship | TPC Sawgrass | 0.41 | 10 | 0.39 | 9 | 0.3 | 16 | 0.35 | 24 | 0.06 | 8 |
| 3M Open | TPC Twin Cities | 0.41 | 11 | 0.39 | 12 | 0.3 | 14 | 0.33 | 29 | 0.07 | 6 |
| THE NORTHERN TRUST | Liberty National Golf Club | 0.41 | 12 | 0.38 | 13 | 0.12 | 33 | 0.44 | 14 | 0.09 | 4 |
| RBC Canadian Open | Hamilton Golf & Country Club | 0.4 | 13 | 0.38 | 14 | 0.34 | 7 | 0.58 | 1 | 0.02 | 27 |
| Waste Management Phoenix Open | TPC Scottsdale | 0.4 | 14 | 0.39 | 11 | 0.17 | 28 | 0.45 | 13 | 0.09 | 5 |
| Arnold Palmer Invitational | Bay Hill Club & Lodge | 0.39 | 15 | 0.37 | 16 | 0.33 | 10 | 0.24 | 33 | 0.06 | 7 |
| Wyndham Championship | Sedgefield Country Club | 0.39 | 16 | 0.39 | 10 | 0.3 | 12 | 0.55 | 4 | 0.05 | 11 |
| AT&T Byron Nelson | Trinity Forest Golf Club | 0.36 | 17 | 0.35 | 18 | 0.19 | 27 | 0.42 | 16 | 0.05 | 12 |
| The Honda Classic | PGA National (Champion) | 0.36 | 18 | 0.34 | 20 | 0.23 | 22 | 0.37 | 23 | 0.04 | 14 |
| Shriners Hospitals for Children Open | TPC Summerlin | 0.36 | 19 | 0.34 | 19 | 0.28 | 17 | 0.5 | 7 | 0.02 | 21 |
| Wells Fargo Championship | Quail Hollow Club | 0.36 | 20 | 0.33 | 22 | 0.22 | 24 | 0.34 | 27 | 0.05 | 13 |
| Charles Schwab Challenge | Colonial Country Club | 0.36 | 21 | 0.35 | 17 | 0.3 | 13 | 0.4 | 20 | 0.02 | 24 |
| BMW Championship | Medinah Country Club (No. 3) | 0.34 | 22 | 0.32 | 23 | 0.35 | 6 | 0.22 | 34 | 0.01 | 31 |
| Valspar Championship | Innisbrook Resort (Copperhead) | 0.34 | 23 | 0.34 | 21 | 0.24 | 19 | 0.46 | 12 | 0.02 | 23 |
| Farmers Insurance Open | Torrey Pines GC (South) | 0.33 | 24 | 0.31 | 24 | 0.34 | 9 | 0.32 | 31 | 0.01 | 32 |
| WGC-Mexico Championship | Club de Golf Chapultepec | 0.32 | 25 | 0.28 | 30 | 0.32 | 11 | 0.56 | 2 | 0.02 | 28 |
| Rocket Mortgage Classic | Detroit Golf Club | 0.32 | 26 | 0.31 | 25 | 0.3 | 15 | 0.4 | 19 | 0.01 | 34 |
| Barbasol Championship | Keene Trace Golf Club | 0.32 | 27 | 0.31 | 26 | 0.23 | 23 | 0.49 | 9 | 0.04 | 15 |
| Valero Texas Open | TPC San Antonio (Oaks Course) | 0.3 | 28 | 0.28 | 28 | 0.09 | 35 | 0.5 | 6 | 0.02 | 25 |
| Sony Open in Hawaii | Waialae Country Club | 0.3 | 29 | 0.29 | 27 | 0.26 | 18 | 0.2 | 35 | 0.03 | 19 |
| Desert Classic | Stadium Course | 0.29 | 30 | 0.28 | 31 | 0.21 | 25 | 0.52 | 5 | 0.03 | 20 |
| RBC Heritage | Harbour Town Golf Links | 0.28 | 31 | 0.28 | 29 | 0.15 | 31 | 0.32 | 30 | 0.04 | 18 |
| Safeway Open | Silverado Resort and Spa North | 0.26 | 32 | 0.24 | 32 | 0.16 | 30 | 0.42 | 17 | 0.02 | 22 |
| Sanderson Farms Championship | CC of Jackson | 0.26 | 33 | 0.23 | 33 | 0.24 | 20 | 0.34 | 28 | 0.02 | 26 |
| AT&T Pebble Beach Pro-Am | Pebble Beach Golf Links | 0.24 | 34 | 0.22 | 34 | 0.09 | 34 | 0.48 | 10 | 0.04 | 16 |
| Genesis Open | Riviera Country Club | 0.2 | 35 | 0.18 | 35 | 0.13 | 32 | 0.38 | 22 | 0.01 | 33 |
In calculating each missed-fairway penalty estimate, the difference in skill between those playing from the fairway and those playing from the non-fairway is accounted for. Perhaps surprisingly, the skill difference is almost negligible when averaged across all events, with an overall gap of just 0.001 strokes (i.e. the average non-OTT skill of those playing from the fairway is 0.001 strokes better per hole than the skill of those playing from non-fairway). This hardly matters anyways, as a meaningful skill difference would be on the order of 0.01 strokes per hole (which is ~0.2 strokes per round), but this is dwarfed by the differences in missed-fairway penalties across courses seen in the table above.
Now, let's discuss some of the takeaways. As expected, Estimate 2 is uniformly lower than Estimate 1, which is due to the fact that the non-fairway shots in Estimate 1 are on average slightly further from the hole than the fairway shots. Overall, however, Estimates 1 and 2 are very highly correlated. Estimate 3 is less correlated; recall that it is an estimate of the difference in the number of strokes to hole out from the fairway versus the rough. The discrepancies between Estimate 3 and Estimates 1 and 2 can be resolved by looking at the final 4 columns. For example, Kapalua, Sea Island, and TPC River Highlands all have low values for Estimate 3 compared to their Estimate 1 and 2 values. This is easily reconciled by noticing that they are ranked #2, #1, and #3 in the fraction of missed fairways that lead to penalty strokes.
One noteworthy course is TPC Deere Run. It consistently ranks in the top half of courses in terms of missed-fairway penalty, and it is specifically driven by the rough penalty, as it yields very few penalty strokes and is relatively easy from non-rough locations. What's the likely story? The John Deere is typically a low scoring affair, and to hit shots close you need to be in the fairway. At the other extreme, you have Riviera, which consistently has the smallest missed-fairway penalty on tour. It's not clear what the whole story is here, but it's likely related to the fact that Riviera also has one of the lowest GIR percentages on tour. There are several courses whose data backs up what intuition would suggest: Bethpage Black, East Lake, and TPC Southwind are all known for brutal (albeit, different) rough, and their penalties for a missed fairway support that sentiment. One course you would think fits this mold, but doesn't really according to the data, is the South Course at Torrey Pines. (Although its rough penalty is still ranked a respectable 9th out of 35 courses.)
With respect to the overall relationships between missed-fairway penalties and course characteristics, there is a positive correlation between the penalty for missing a fairway and how easy it is to hit the fairway. This correlation with overall driving accuracy is strongest for Estimate 1 (0.52) — part of this is mechanical because a 280-yard drive that misses the fairway at say, Kapalua, has to be hit way offline (and will have a longer approach into the green). This correlation decreases slightly with Estimate 2 (0.49), and almost disappears with Estimate 3 (0.08). Therefore, it must be the case that courses with easier-to-hit fairways tend to have hazards or OB closer to the fairway's edge. Kapalua, Sea Island, and River Highlands are all examples of this. Interestingly, there is no correlation between a course's yardage and Estimate 1 or 2, but there is a positive correlation with Estimate 3 (0.25). There is a small negative correlation of all 3 estimates with GIR (-0.1), and a (shocker) positive correlation with score relative-to-par (0.15).
Estimating fairway width
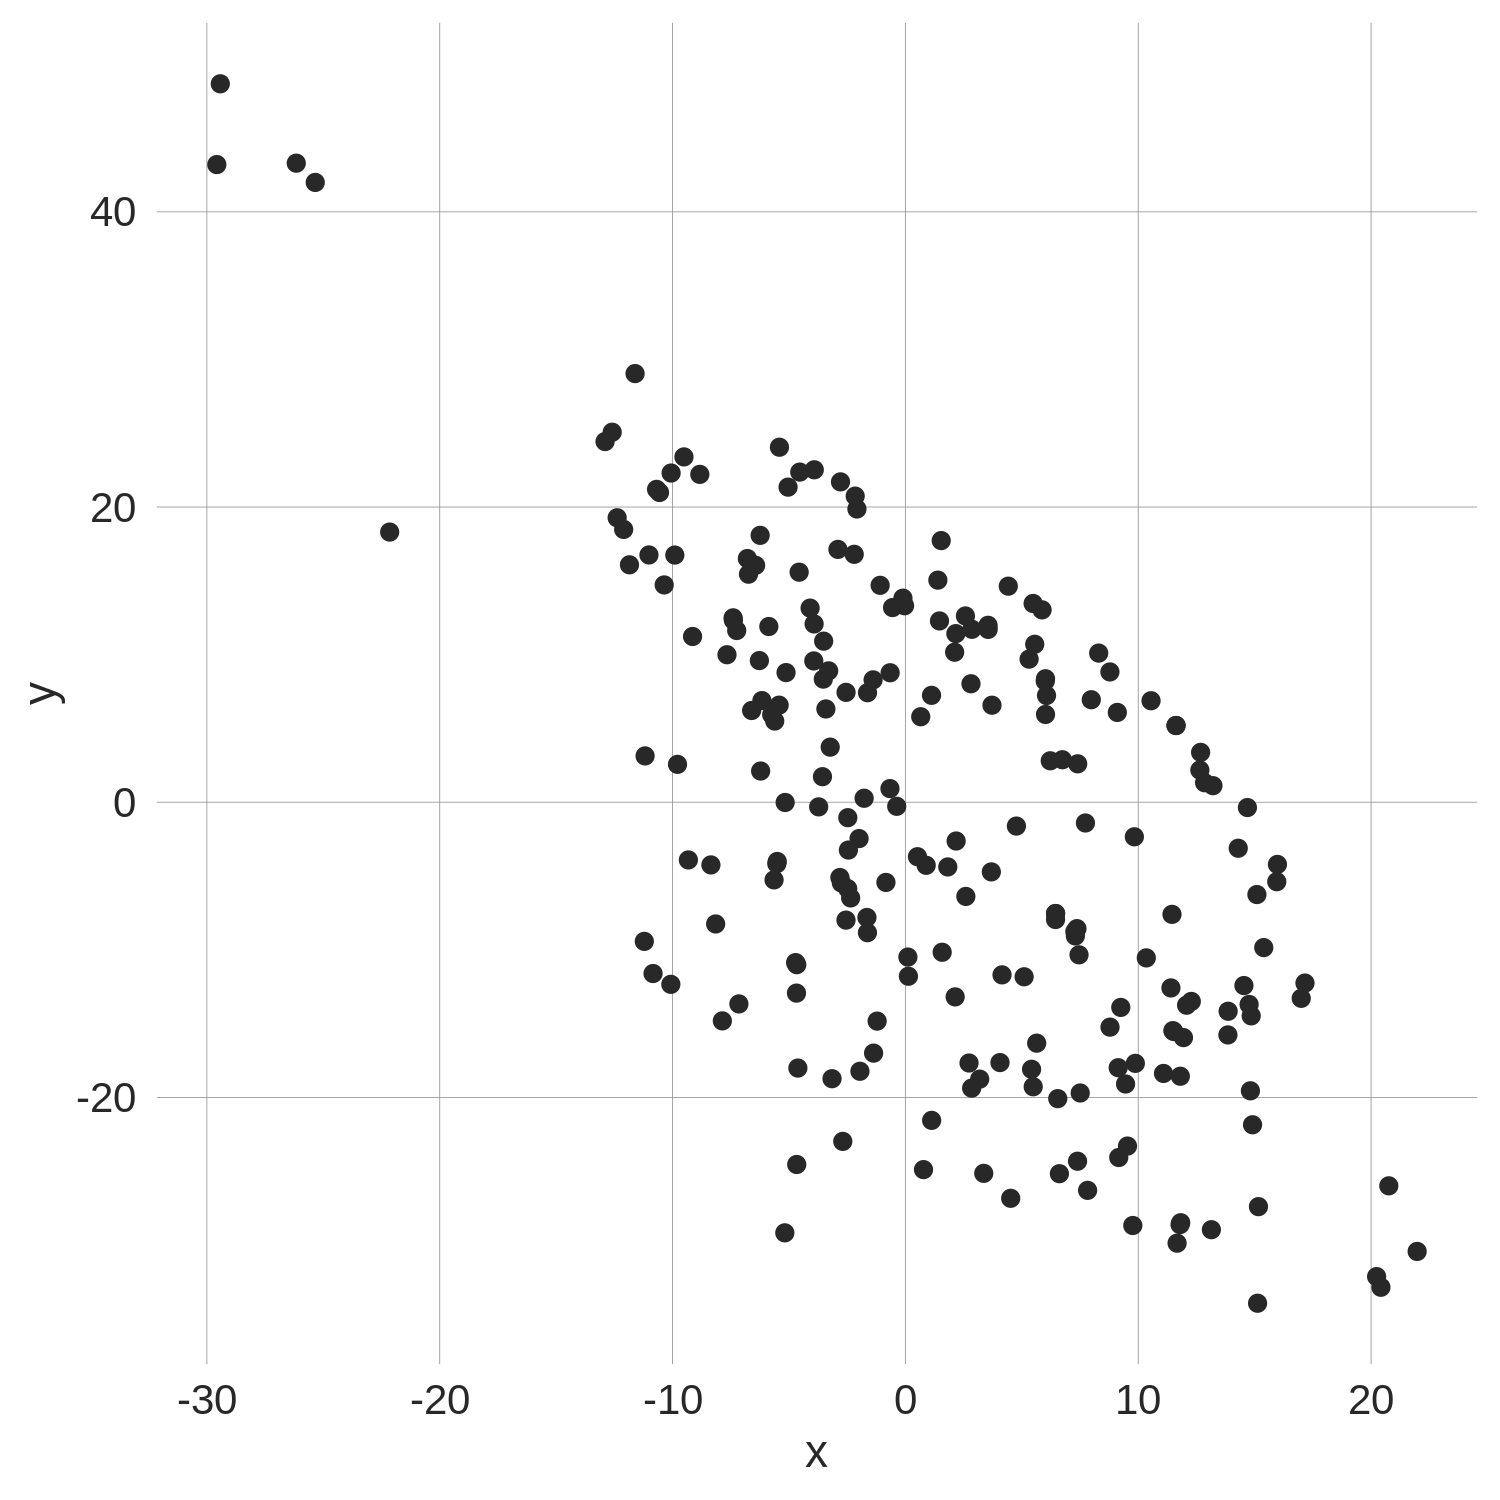
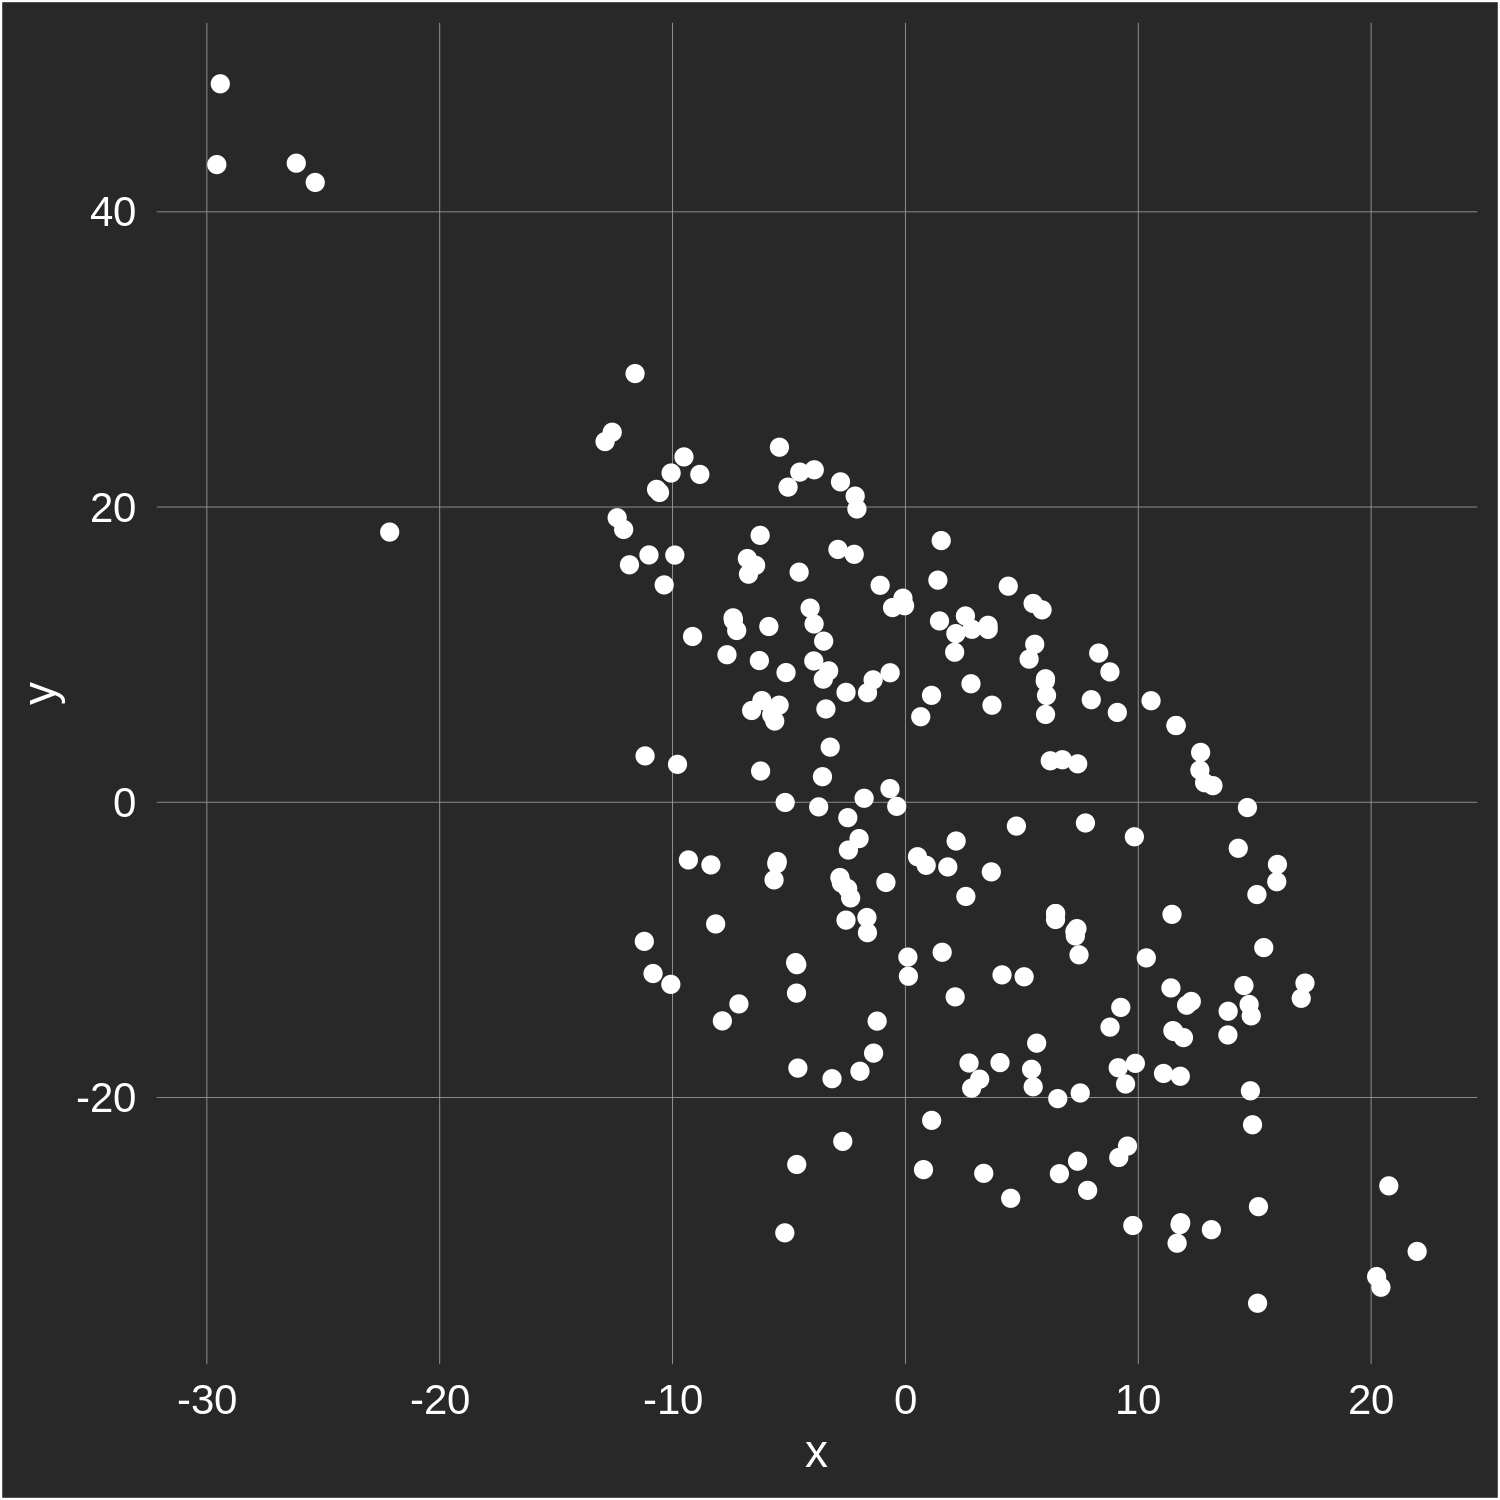
To estimate the width of a fairway on a given hole, we first use the ending location of all tee shots
to map out the approximate shape of the fairway. For example, shown below are the x-y coordinates of all
teeshots that found the
fairway on the par-5 6th hole at the 2019 Bay Hill Invitational:
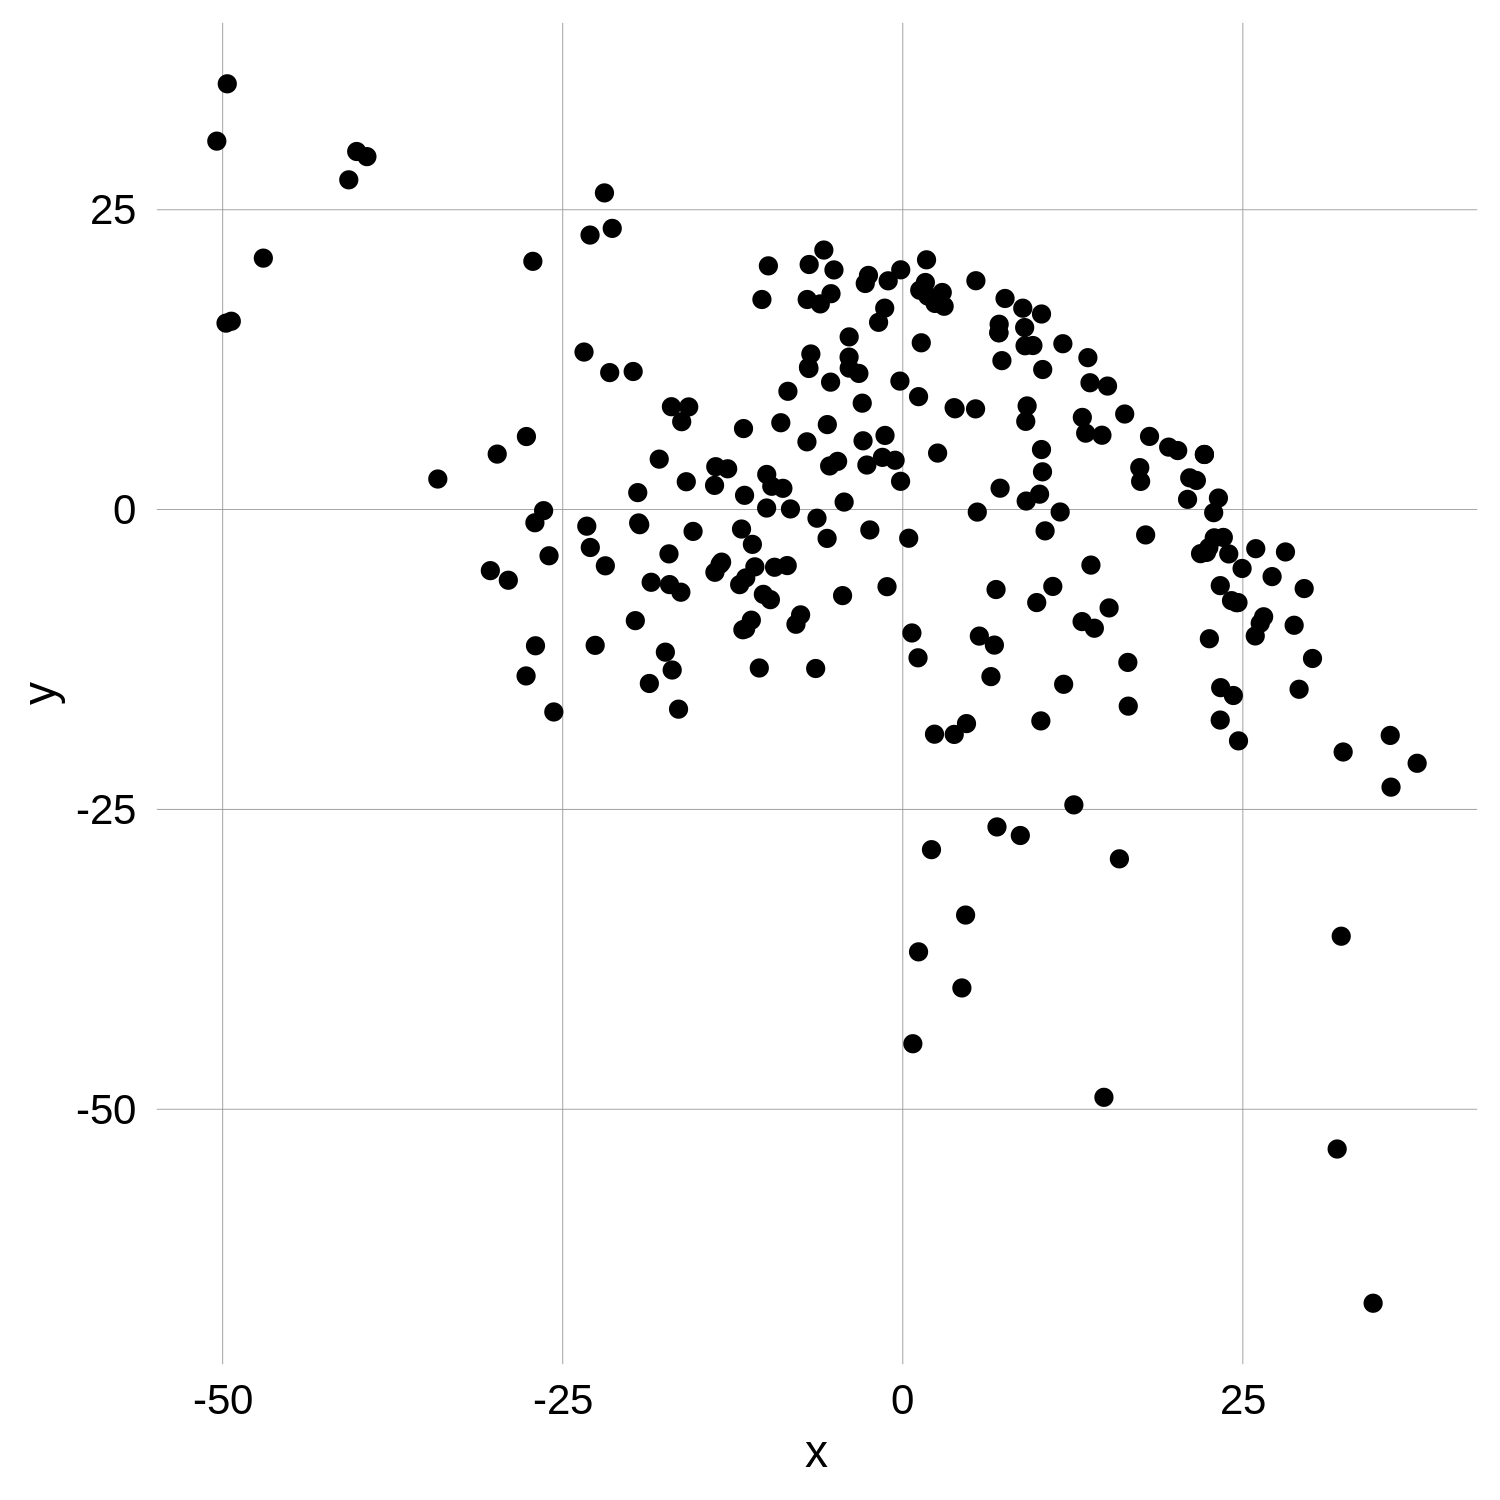
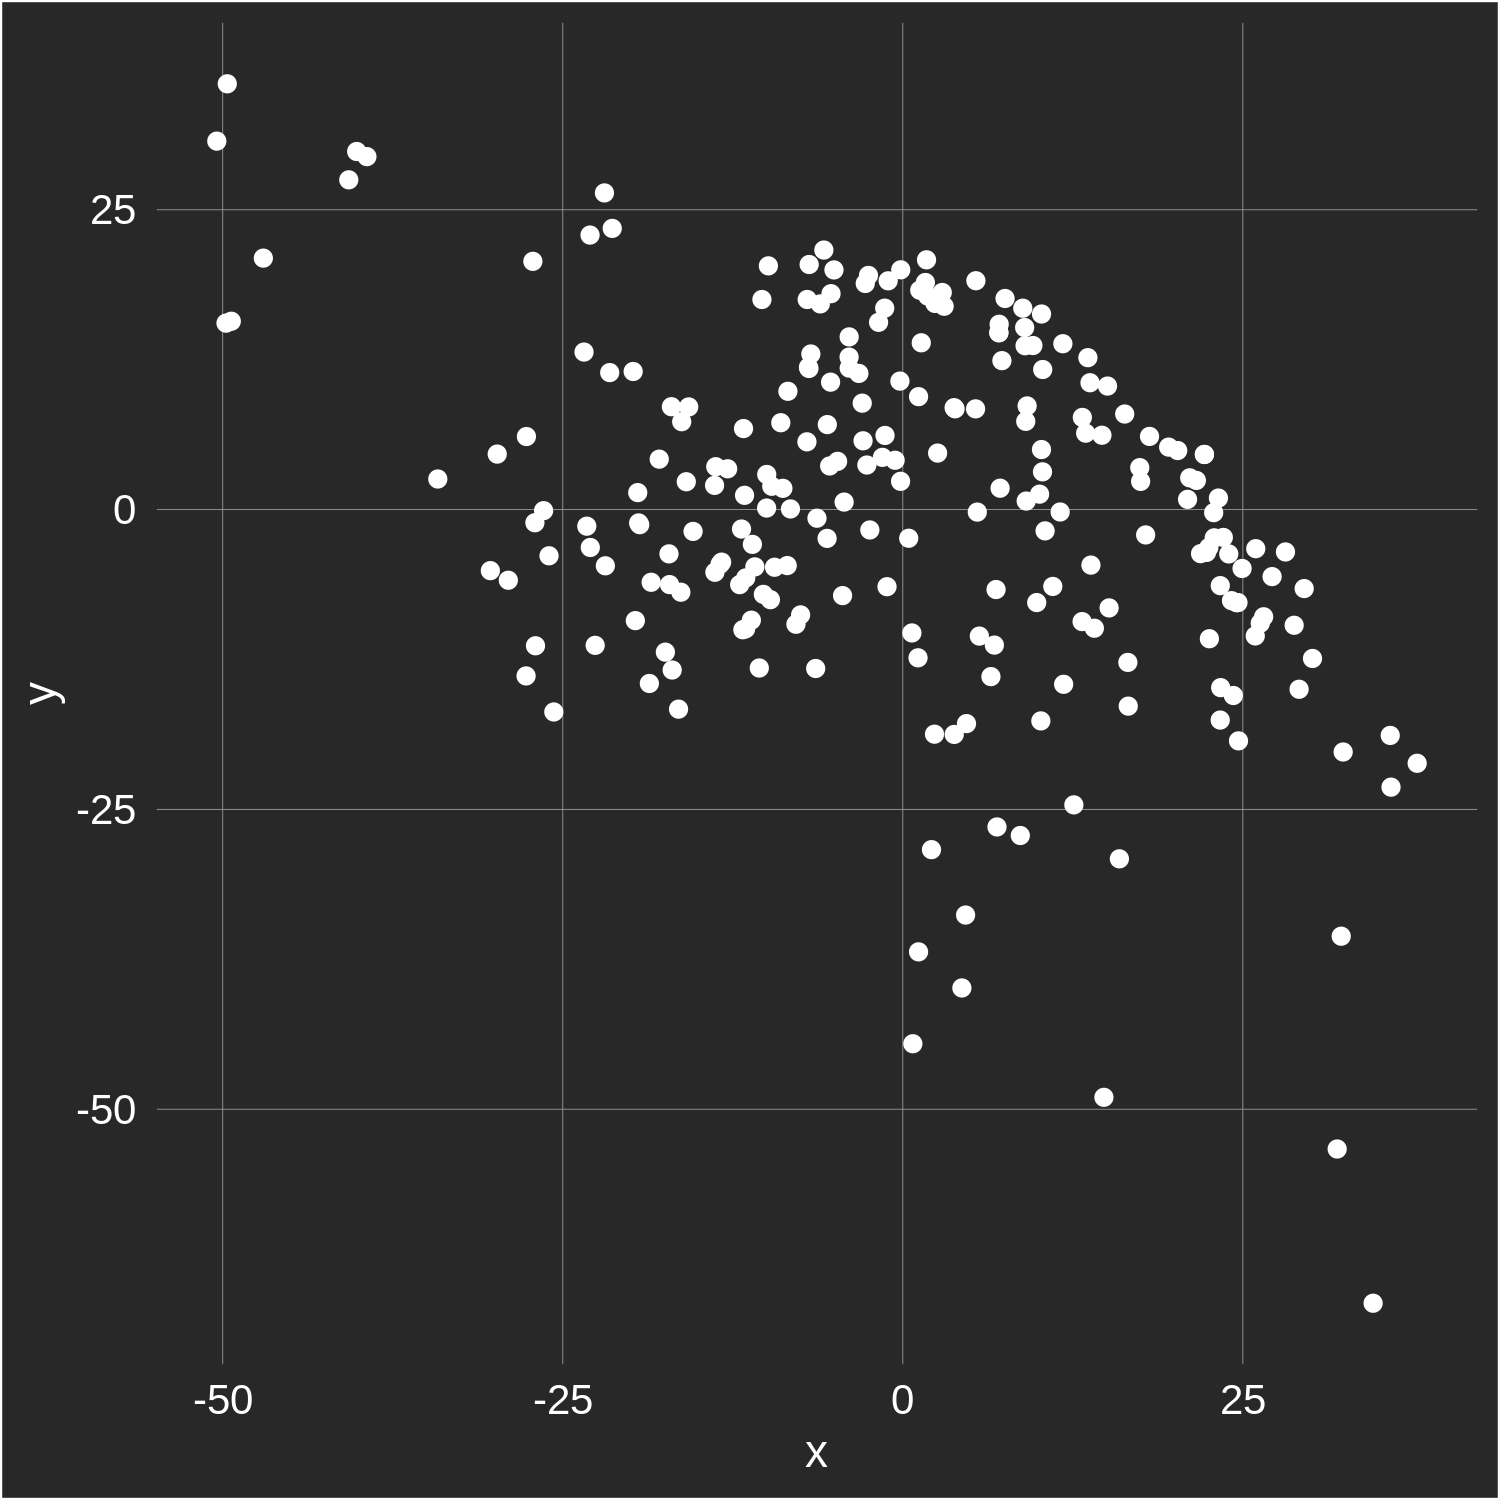 This coordinate system is
oriented so that the vertical line at x=0 runs through the tee box (we use the average tee box location across the 4 rounds)
and the ending location of the average
tee shot. The coordinates (0,0) mark the location of the average fairway tee shot. Therefore this orientation provides
a view of the fairway from the perspective of a golfer standing on the tee box.
This coordinate system is
oriented so that the vertical line at x=0 runs through the tee box (we use the average tee box location across the 4 rounds)
and the ending location of the average
tee shot. The coordinates (0,0) mark the location of the average fairway tee shot. Therefore this orientation provides
a view of the fairway from the perspective of a golfer standing on the tee box.
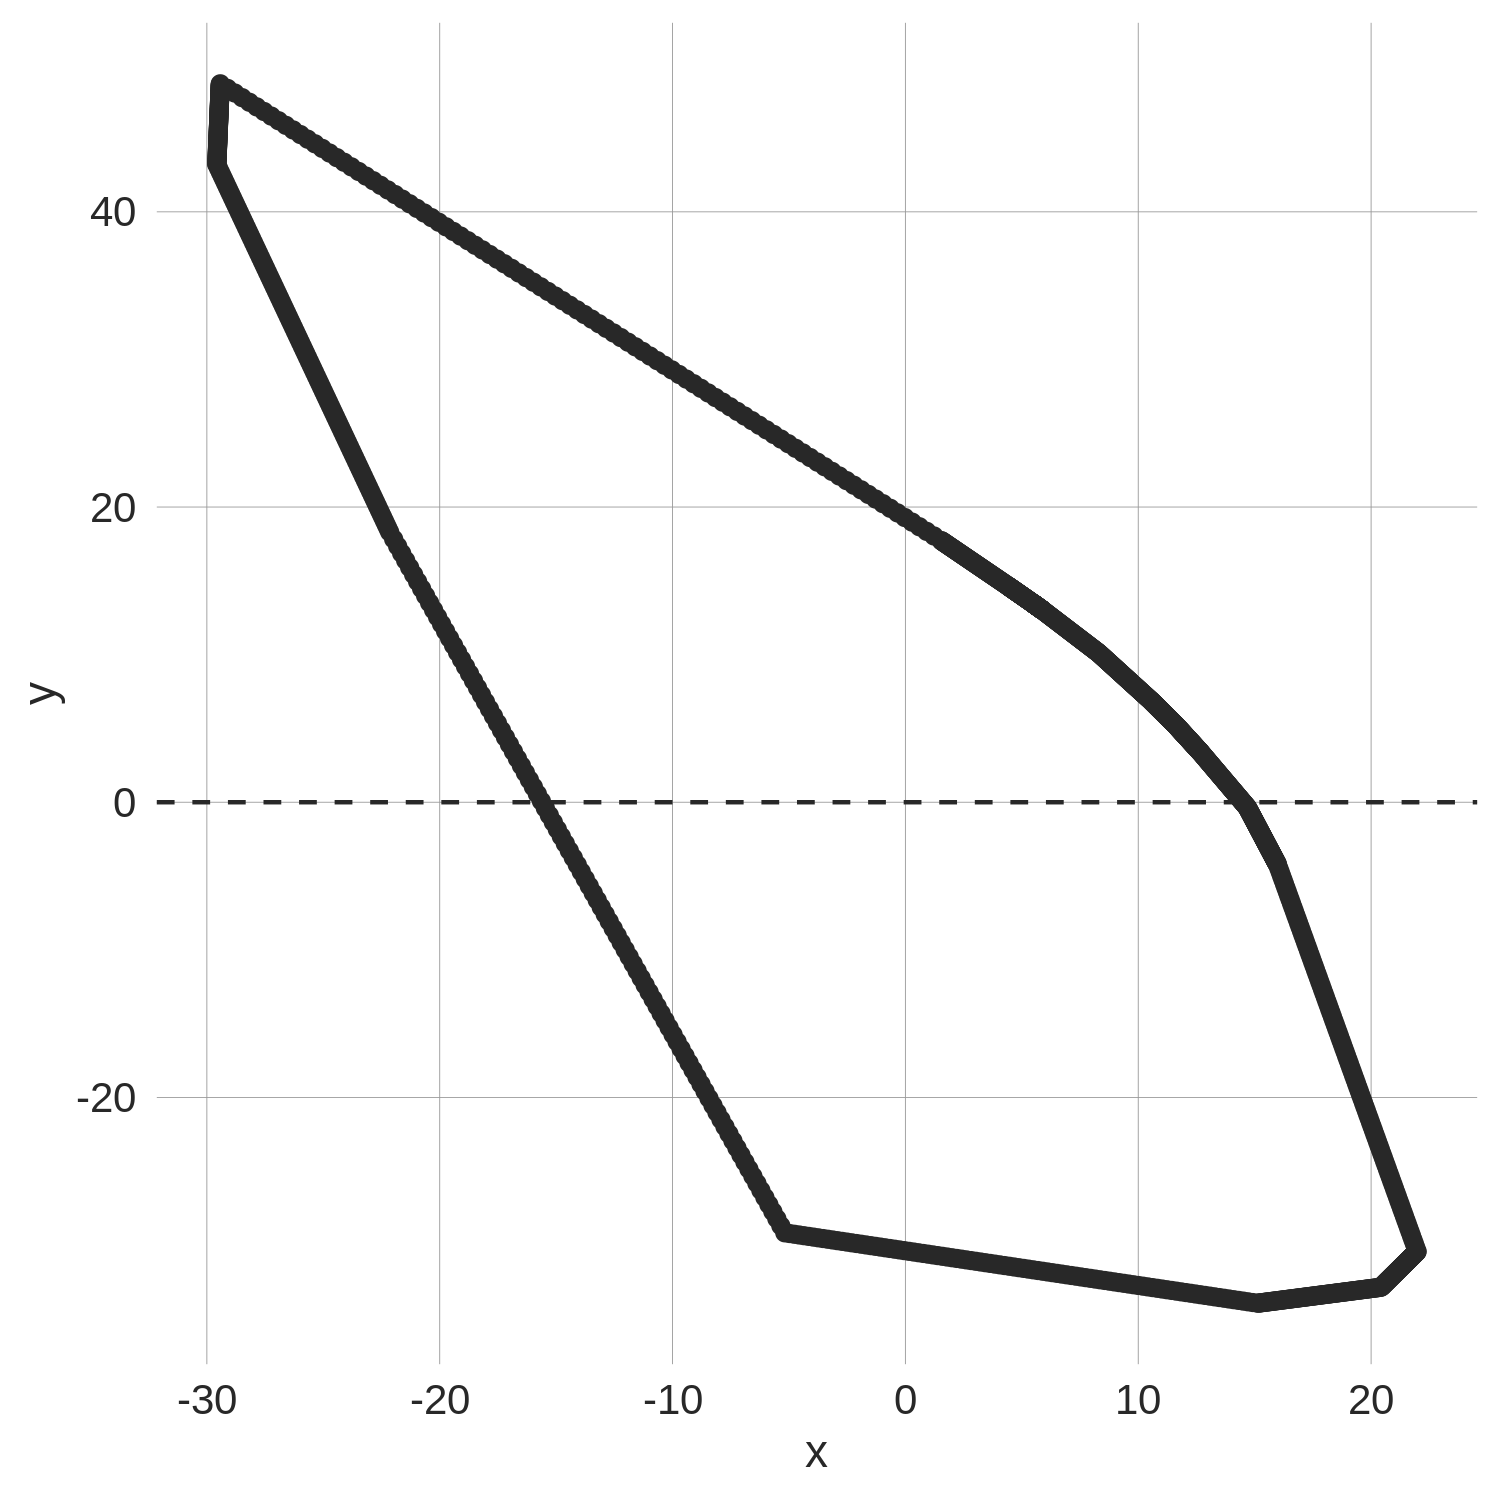
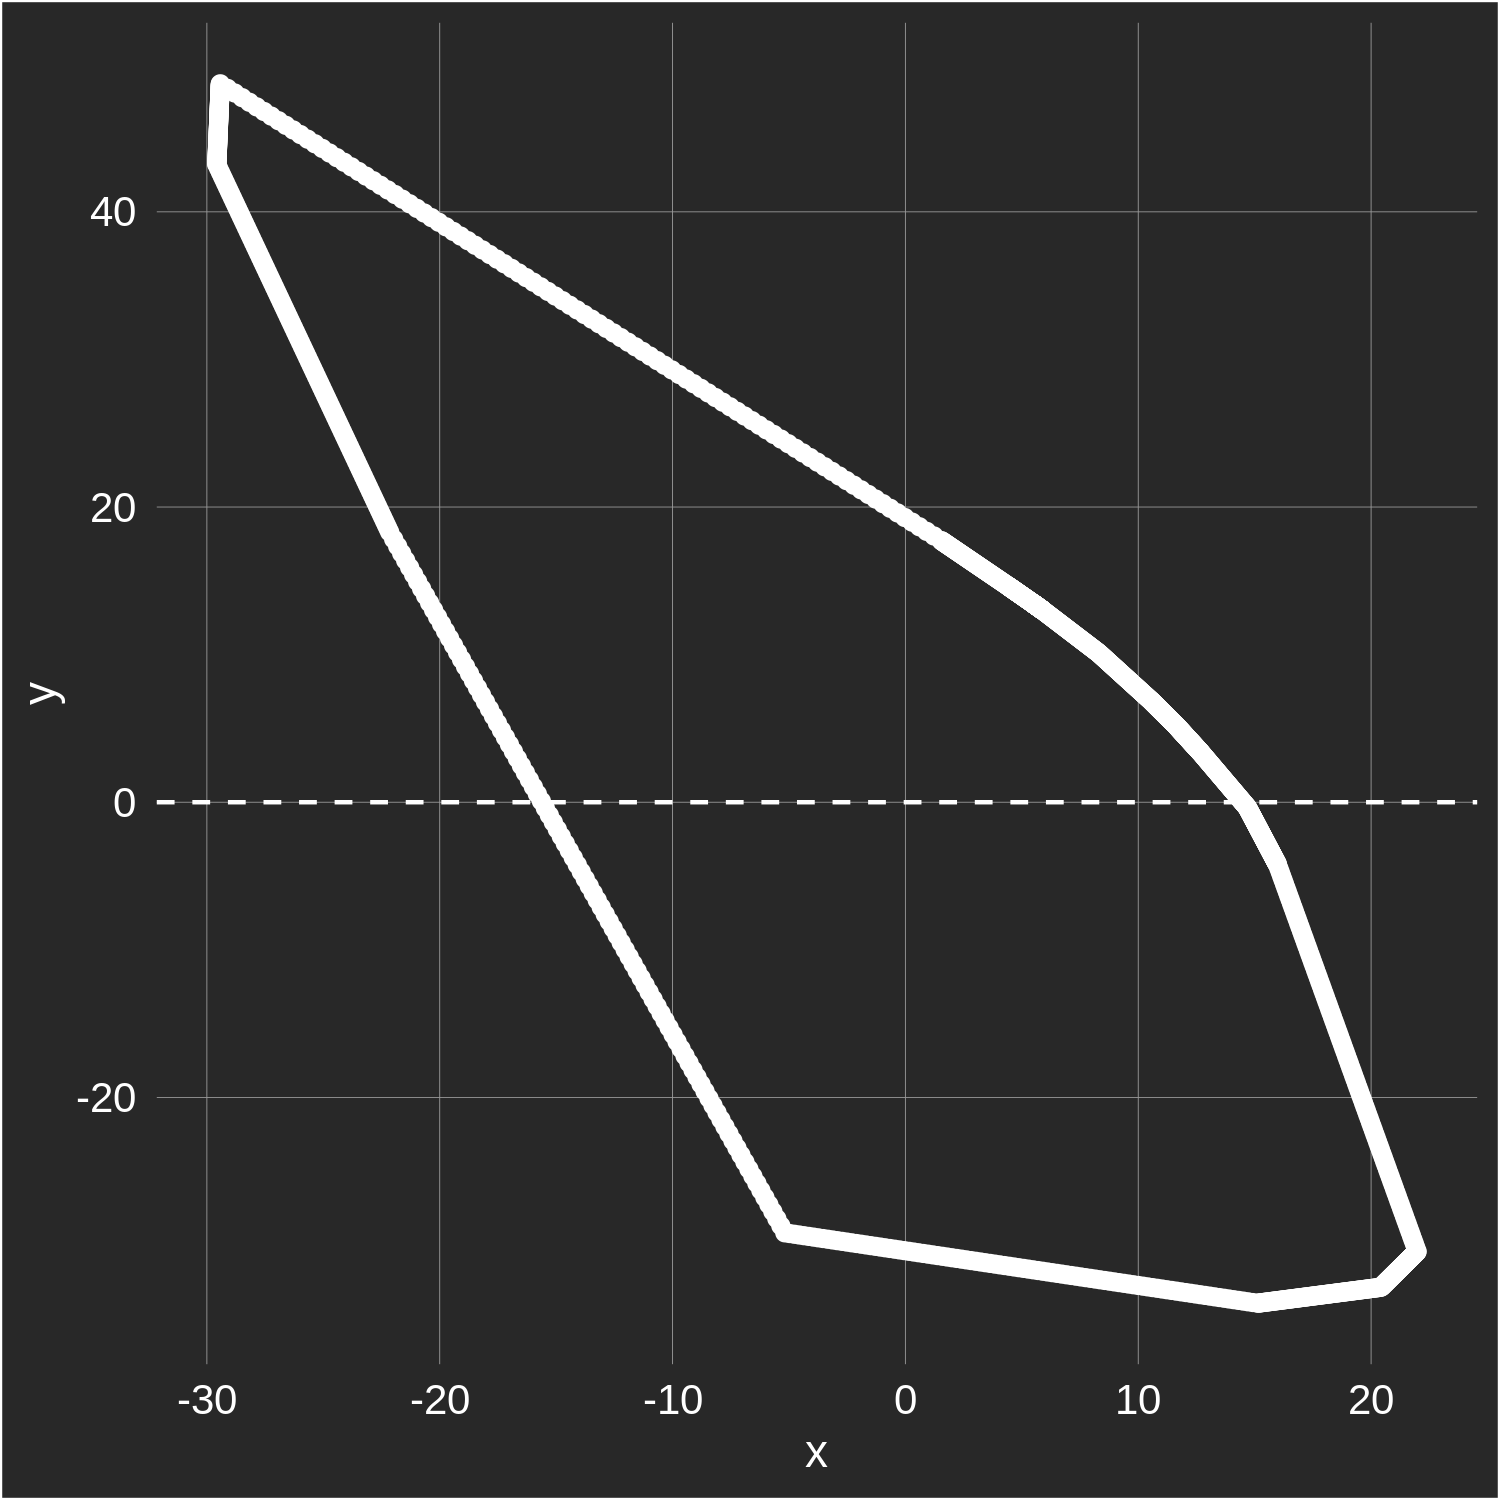
Next, we map out the fairway by drawing a shape that contains all of the above data points (more specifically, we find the convex hull of the data). For #6 at Bay Hill, this exercise yields the following:
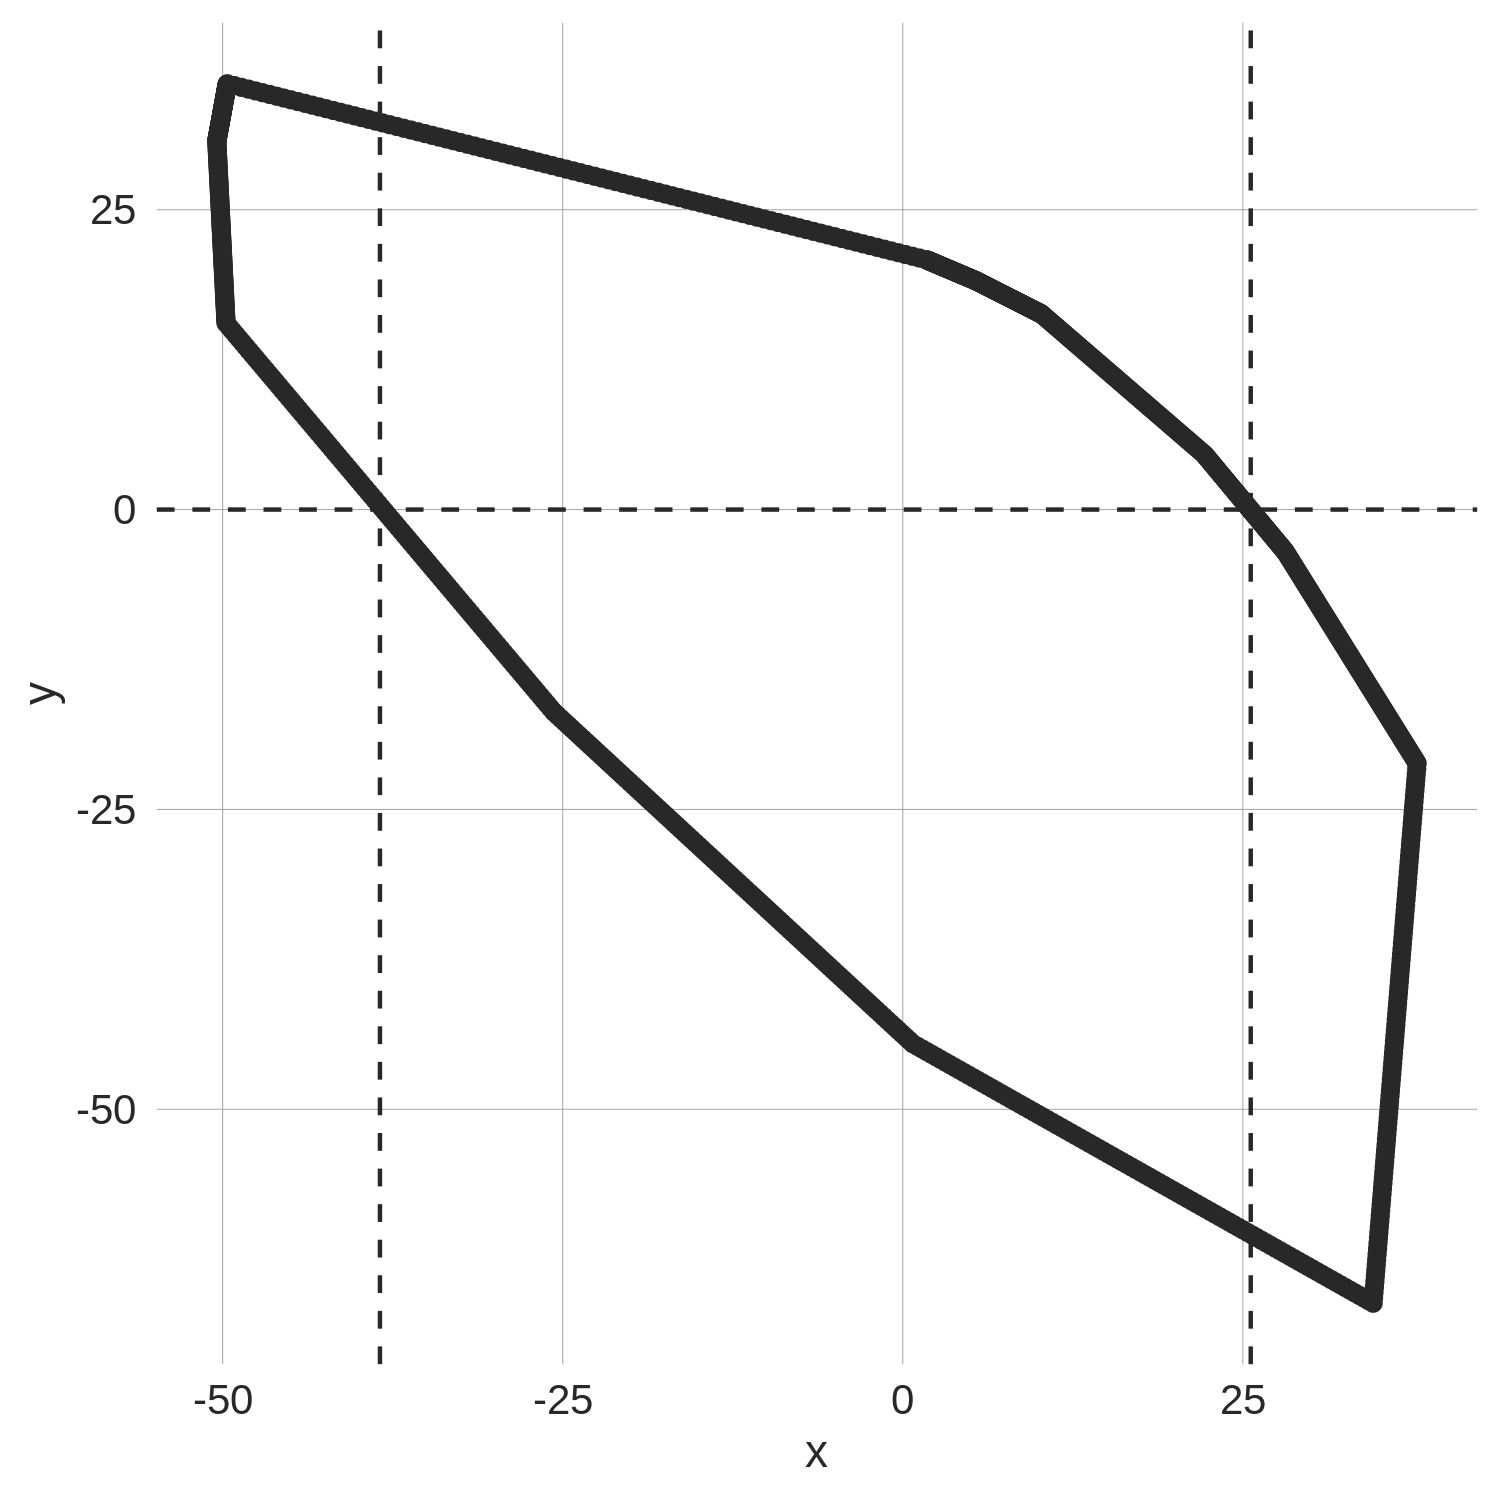
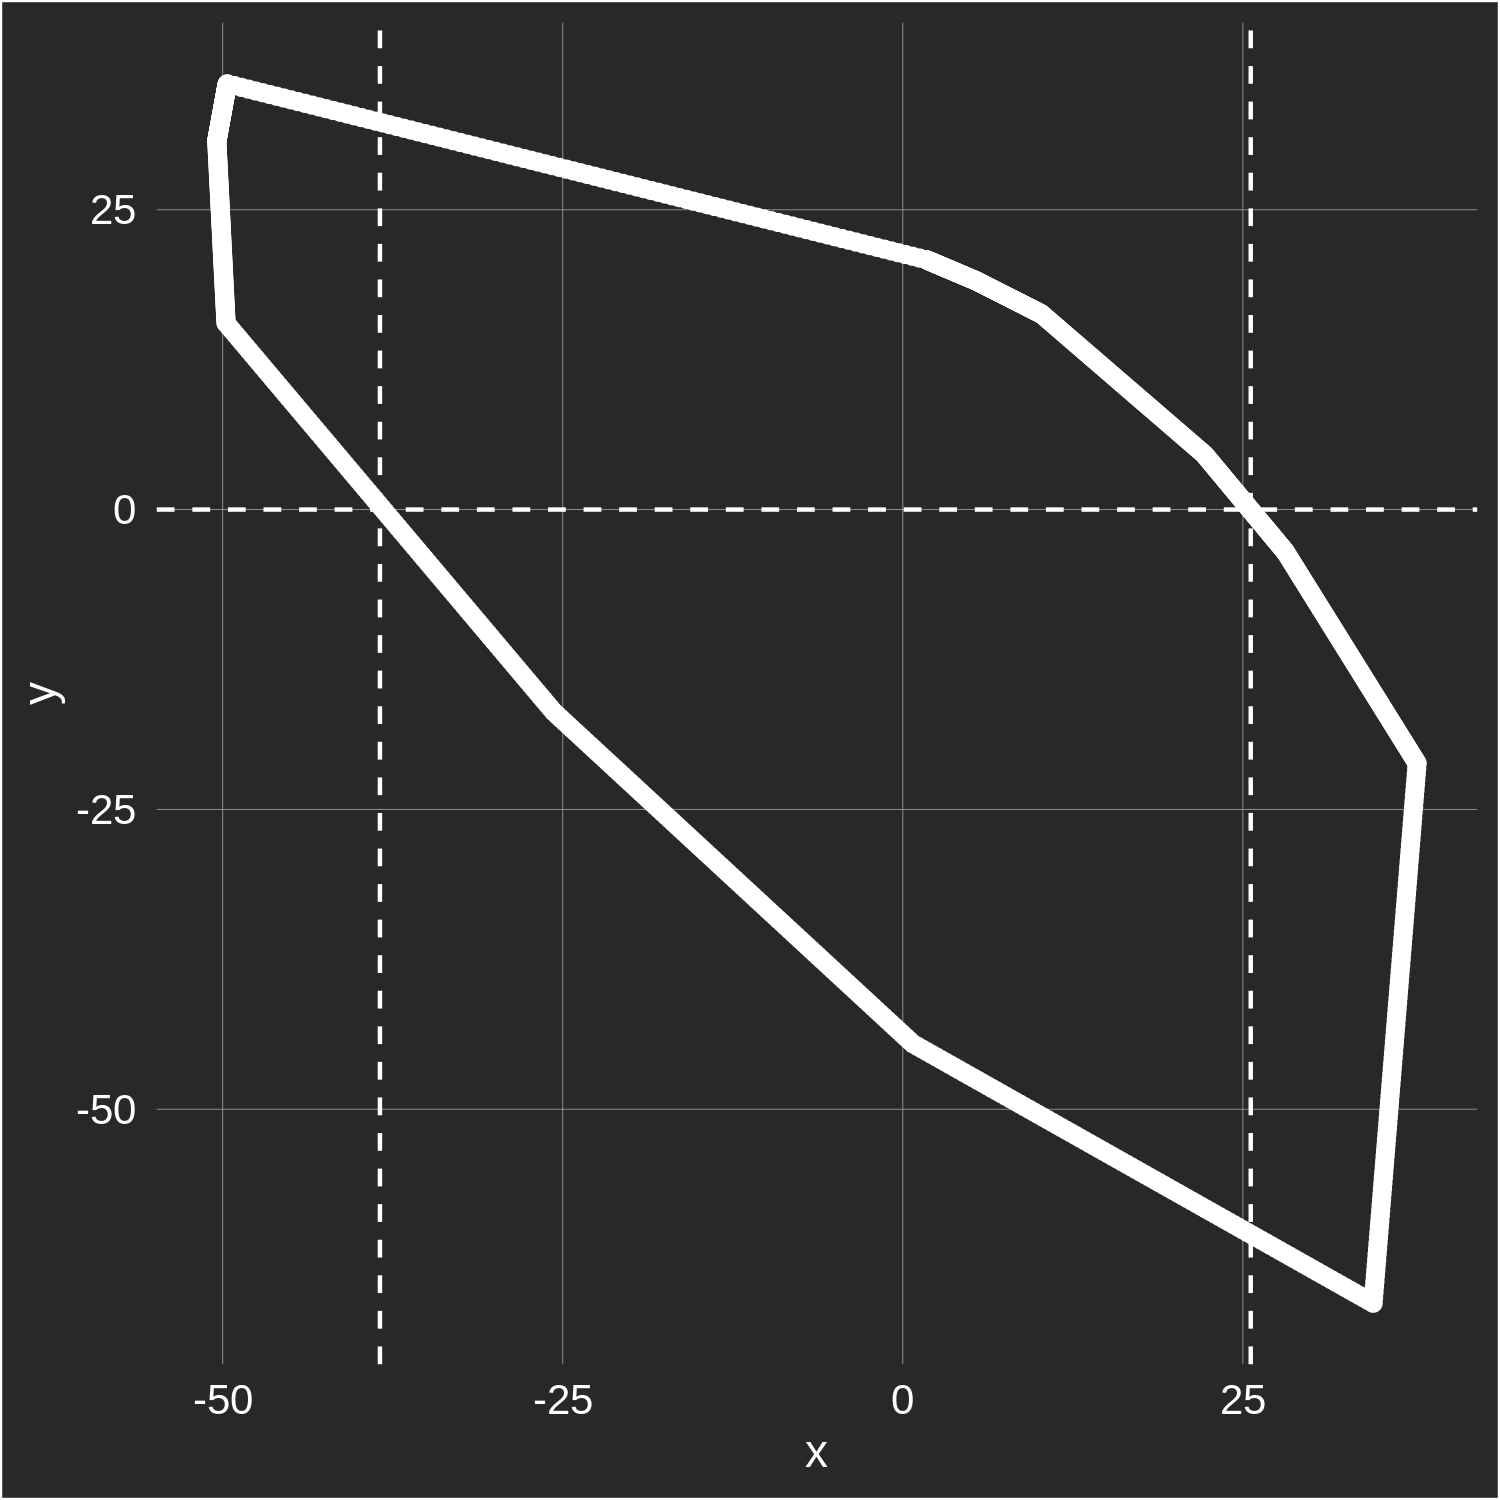 With the location of the fairway's edges approximated, the final step is to calculate the width of the fairway at
y=0 (i.e. at the distance from the tee of the average tee shot). In this case, the left edge of the fairway
at y=0 is 38 yards left of the average drive, and the right fairway edge is 25 yards right of the average
drive, which yields an estimated fairway width of 63 yards.
With the location of the fairway's edges approximated, the final step is to calculate the width of the fairway at
y=0 (i.e. at the distance from the tee of the average tee shot). In this case, the left edge of the fairway
at y=0 is 38 yards left of the average drive, and the right fairway edge is 25 yards right of the average
drive, which yields an estimated fairway width of 63 yards.
There are a few points worth mentioning. First, clearly we are not accurately estimating the shape of the fairway in the areas far from the average drive (as, by definition, there are very few balls hit in these spots to inform our shape estimate). However, because we only care about width at the location of the average tee shot, this is not really a problem. Second, we will tend to slightly underestimate fairway width given we are throwing the smallest net possible over all fairway balls — if there is, for example, space between the rightmost teeshot in the fairway, and the fairway's edge, we will miss that space in our width calcuation. Third, due to the nature of the convex hull algorithm, sharp curvature in the fairway may not be captured well; this can lead us to overestimate fairway width on dogleg holes. This doesn't actually appear to be much of a problem; even on holes with sharp doglegs, it's rare for the distribution of drives to actually curve around the fairway. For a slightly problematic example, here's the 14th hole at Waialae Country Club from the 2019 Sony Open:
 The 'convex' part of convex hull basically just means we need to draw a shape such that a line drawn
between any two points in the data is contained within the shape. This prevents us from capturing the true
shape of the inner edge of the dogleg (but doesn't prevent us from accurately drawing the outer edge). The result here
is that we overestimate fairway width at y=0 by 2-3 yards.
The 'convex' part of convex hull basically just means we need to draw a shape such that a line drawn
between any two points in the data is contained within the shape. This prevents us from capturing the true
shape of the inner edge of the dogleg (but doesn't prevent us from accurately drawing the outer edge). The result here
is that we overestimate fairway width at y=0 by 2-3 yards.
As you toggle through different years at the same course, you will, in some cases, notice substantial variation in our estimated fairway width. This can occur even without changes being made to the course if the location of the average drive has moved to a different section of the fairway. Sometimes this new location is actually at a distance in the fairway with a different width, and other times it unfortunately may reflect the sensitivity of the shape algorithm to small changes in the distribution of drives.
Next, we map out the fairway by drawing a shape that contains all of the above data points (more specifically, we find the convex hull of the data). For #6 at Bay Hill, this exercise yields the following:
There are a few points worth mentioning. First, clearly we are not accurately estimating the shape of the fairway in the areas far from the average drive (as, by definition, there are very few balls hit in these spots to inform our shape estimate). However, because we only care about width at the location of the average tee shot, this is not really a problem. Second, we will tend to slightly underestimate fairway width given we are throwing the smallest net possible over all fairway balls — if there is, for example, space between the rightmost teeshot in the fairway, and the fairway's edge, we will miss that space in our width calcuation. Third, due to the nature of the convex hull algorithm, sharp curvature in the fairway may not be captured well; this can lead us to overestimate fairway width on dogleg holes. This doesn't actually appear to be much of a problem; even on holes with sharp doglegs, it's rare for the distribution of drives to actually curve around the fairway. For a slightly problematic example, here's the 14th hole at Waialae Country Club from the 2019 Sony Open:
As you toggle through different years at the same course, you will, in some cases, notice substantial variation in our estimated fairway width. This can occur even without changes being made to the course if the location of the average drive has moved to a different section of the fairway. Sometimes this new location is actually at a distance in the fairway with a different width, and other times it unfortunately may reflect the sensitivity of the shape algorithm to small changes in the distribution of drives.
Understanding within-event correlations between player stats and performance
For each event we report the correlation of various statistics from that tournament
with total strokes-gained from that same tournament. We call these "within-event" correlations.
They stand in contrast to the types of correlations reported
on the course fit page, where
pre-tournament player attributes (e.g. a player's predicted driving distance) are correlated
with subsequent performance in the tournament. If your concerns lie mainly with prediction,
the latter correlations are more relevant, but this within-event analysis
can also provide interesting information.
As is mentioned on the historical stats page, these correlations are at the round-level and are raw correlations. Therefore, if players who hit it above-average distances off the tee during an event also had above-average putting, this will be loaded into the simple correlation between driving distance and total strokes-gained for that week. This adds noise, but we wanted to keep things as transparent as possible. When looking at the PGA Tour average correlations (the black dots), it might be surprising that — of the statistics considered — driving distance has the weakest relationship with overall performance during a tournament. However, the strokes-gained category statistics have a distinct advantage here: they are mechanically related to total strokes-gained. Increasing SG APP by 1 stroke also increases SG Total by 1 stroke. Further, when considering within-event correlations, high-variance statistics are more likely to show strong correlations. As an extreme example, suppose that after the end of each round each player flipped a coin to determine whether they add or subtract 5 strokes from their score for the day; we'll call this "SG Coin Flip". SG Coin Flip will be very strongly correlated with performance during a given week, but it will show no correlation when used as a predictor of future performance. Strokes-gained putting and approach are the two highest variance SG statistics, and their higher average correlations with SG Total reflect this.
Driving distance and driving accuracy are not mechanically related to SG Total, and as a result show weaker correlations with it. Driving accuracy is a higher variance statistic than driving distance, which is part of the reason why it has a stronger relationship with overall performance in a tournament. The other part of the reason it has a higher correlation is that, contrary to popular belief, driving accuracy is still really important on the PGA Tour! Put another way, you would do a better job predicting performance at a tournament by looking at driving accuracy during the week than you would by looking at driving distance. However, if you wanted to predict performance next week, looking at players' driving distance numbers would tell you more than their driving accuracy, as the course fit tool shows.
With the general discussion out of the way, let's consider the within-event correlations from a specific tournament, the 2021 U.S. Open at Winged Foot:
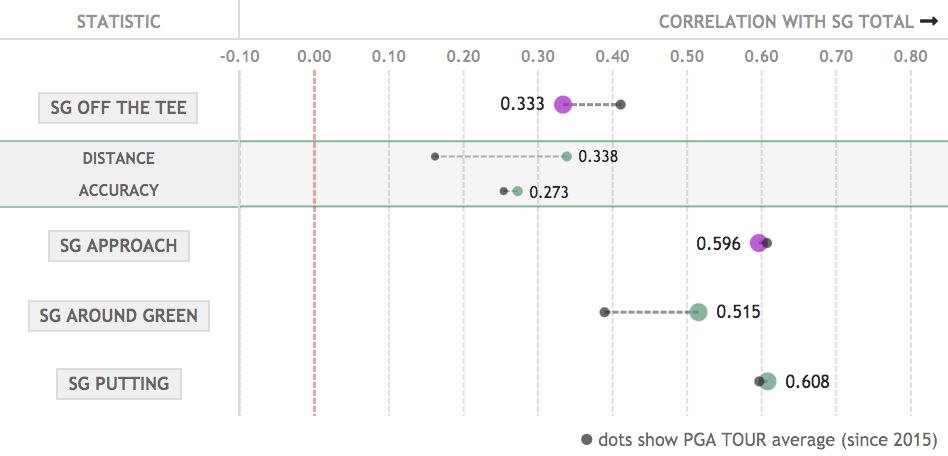
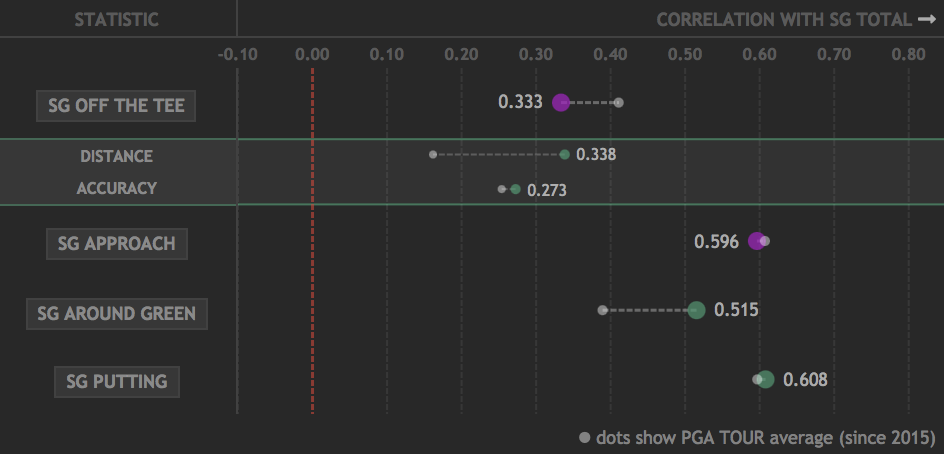
The narrative by week's end at Winged Foot, largely fueled by Bryson Dechambeau's dominant win, was that, despite the narrow fairways and long rough, the course strongly favoured bombers. In looking at the correlation plot, we do indeed see that the correlation between driving distance and SG Total was well above-average (it was the 5th highest distance correlation since 2015 on the PGA Tour). However, driving accuracy was also correlated with SG Total slightly more than the average PGA Tour event. This is unusual, as typically if driving distance has a stronger correlation, driving accuracy will have a weaker one (the correlation of these correlations is -0.2 across all events). This did not occur at Winged Foot because golfers who hit it further that week also hit it more accurately! It probably makes sense to say that sentence in reverse, as the fairways at Winged Foot rewarded straight drives with firm bounces, adding distance relative to the drives landing in thick rough. The correlation between driving distance and driving accuracy at this U.S. Open was 0.2, the 2nd highest correlation in PGA Tour Shotlink events since 2015. Looking at the leaderboard from that week, it is readily seen that several accurate drivers of the ball had high finishes (although what matters in this analysis is how accurately they drove it in this specific week). In fact, Bryson ended up ranked 19th for the week in driving accuracy (of the 61 players that made the cut).
At this point you should be a bit puzzled; if both driving distance and driving accuracy had above-average correlations with SG Total, and distance and accuracy were positively correlated during the week, how is it possible that SG OTT had a substantially below-average correlation with SG Total? This mystified me for quite a while, and even caused me to question the reliability of U.S. Open Shotlink data. But, eventually I stumbled upon the answer: penalty strokes! Winged Foot, which was an outlier course in many regards, had the 2nd lowest number of penalty strokes per round of all Shotlink courses since 2015. Penalty strokes are a significant contributer to the variance in SG OTT, and, as stated earlier, variance is the main driver of within-event correlations for the SG categories. (Correlations with other SG categories also contributes, e.g. if those with high SG OTT also had high SG APP.) Most courses with very few penalty strokes report weaker correlations between SG OTT and SG Total.
There is less to say about the correlations of the other strokes-gained categories at this U.S. Open. Winged Foot saw the 3rd fewest greens hit in regulation since 2015 on the PGA Tour, which was the likely cause for it having the 7th highest correlation between SG ARG and SG Total since 2015. Interestingly, despite having the 3rd highest variance in strokes-gained putting since 2015, the correlation between SG PUTT and SG Total was only slightly above average. It appears this was due to a negative correlation between SG PUTT and SG APP.
As these previous few paragraphs attest, making sense of a tournament's within-event correlation plot can require some digging. It is important to remember that a single tournament's worth of data is still greatly affected by statistical noise; many of these correlation plots won't have much meaning beyond providing an explanation of how a specific week played out.
As is mentioned on the historical stats page, these correlations are at the round-level and are raw correlations. Therefore, if players who hit it above-average distances off the tee during an event also had above-average putting, this will be loaded into the simple correlation between driving distance and total strokes-gained for that week. This adds noise, but we wanted to keep things as transparent as possible. When looking at the PGA Tour average correlations (the black dots), it might be surprising that — of the statistics considered — driving distance has the weakest relationship with overall performance during a tournament. However, the strokes-gained category statistics have a distinct advantage here: they are mechanically related to total strokes-gained. Increasing SG APP by 1 stroke also increases SG Total by 1 stroke. Further, when considering within-event correlations, high-variance statistics are more likely to show strong correlations. As an extreme example, suppose that after the end of each round each player flipped a coin to determine whether they add or subtract 5 strokes from their score for the day; we'll call this "SG Coin Flip". SG Coin Flip will be very strongly correlated with performance during a given week, but it will show no correlation when used as a predictor of future performance. Strokes-gained putting and approach are the two highest variance SG statistics, and their higher average correlations with SG Total reflect this.
Driving distance and driving accuracy are not mechanically related to SG Total, and as a result show weaker correlations with it. Driving accuracy is a higher variance statistic than driving distance, which is part of the reason why it has a stronger relationship with overall performance in a tournament. The other part of the reason it has a higher correlation is that, contrary to popular belief, driving accuracy is still really important on the PGA Tour! Put another way, you would do a better job predicting performance at a tournament by looking at driving accuracy during the week than you would by looking at driving distance. However, if you wanted to predict performance next week, looking at players' driving distance numbers would tell you more than their driving accuracy, as the course fit tool shows.
With the general discussion out of the way, let's consider the within-event correlations from a specific tournament, the 2021 U.S. Open at Winged Foot:
The narrative by week's end at Winged Foot, largely fueled by Bryson Dechambeau's dominant win, was that, despite the narrow fairways and long rough, the course strongly favoured bombers. In looking at the correlation plot, we do indeed see that the correlation between driving distance and SG Total was well above-average (it was the 5th highest distance correlation since 2015 on the PGA Tour). However, driving accuracy was also correlated with SG Total slightly more than the average PGA Tour event. This is unusual, as typically if driving distance has a stronger correlation, driving accuracy will have a weaker one (the correlation of these correlations is -0.2 across all events). This did not occur at Winged Foot because golfers who hit it further that week also hit it more accurately! It probably makes sense to say that sentence in reverse, as the fairways at Winged Foot rewarded straight drives with firm bounces, adding distance relative to the drives landing in thick rough. The correlation between driving distance and driving accuracy at this U.S. Open was 0.2, the 2nd highest correlation in PGA Tour Shotlink events since 2015. Looking at the leaderboard from that week, it is readily seen that several accurate drivers of the ball had high finishes (although what matters in this analysis is how accurately they drove it in this specific week). In fact, Bryson ended up ranked 19th for the week in driving accuracy (of the 61 players that made the cut).
At this point you should be a bit puzzled; if both driving distance and driving accuracy had above-average correlations with SG Total, and distance and accuracy were positively correlated during the week, how is it possible that SG OTT had a substantially below-average correlation with SG Total? This mystified me for quite a while, and even caused me to question the reliability of U.S. Open Shotlink data. But, eventually I stumbled upon the answer: penalty strokes! Winged Foot, which was an outlier course in many regards, had the 2nd lowest number of penalty strokes per round of all Shotlink courses since 2015. Penalty strokes are a significant contributer to the variance in SG OTT, and, as stated earlier, variance is the main driver of within-event correlations for the SG categories. (Correlations with other SG categories also contributes, e.g. if those with high SG OTT also had high SG APP.) Most courses with very few penalty strokes report weaker correlations between SG OTT and SG Total.
There is less to say about the correlations of the other strokes-gained categories at this U.S. Open. Winged Foot saw the 3rd fewest greens hit in regulation since 2015 on the PGA Tour, which was the likely cause for it having the 7th highest correlation between SG ARG and SG Total since 2015. Interestingly, despite having the 3rd highest variance in strokes-gained putting since 2015, the correlation between SG PUTT and SG Total was only slightly above average. It appears this was due to a negative correlation between SG PUTT and SG APP.
As these previous few paragraphs attest, making sense of a tournament's within-event correlation plot can require some digging. It is important to remember that a single tournament's worth of data is still greatly affected by statistical noise; many of these correlation plots won't have much meaning beyond providing an explanation of how a specific week played out.